
Metrics Hub | Cascade Strategy
I led the design of a centralized solution tailored to the needs of enterprise clients. Metrics Hub was developed to streamline metric tracking and reporting, helping clients manage complex data more efficiently.
Role: Senior Product Designer, collaborating closely with product management and engineering teams.
Challenge: Address the scalability and usability issues faced by large B2B clients in metric management.
Goal: Create a unified, accessible interface that reduces manual work, improves data accuracy, and accelerates client adoption.
01
Problem
We noticed an increase in support requests and client feedback pointing to challenges in managing metrics effectively.
Through targeted research, including user interviews and data analysis, we identified several key pain points for these enterprise clients:
Complex Data Management: Clients struggled to track and analyze metrics across multiple teams and projects, leading to inefficient workflows and missed insights.
Manual Updates: Without automated tracking, clients were spending significant time on manual metric updates, often resulting in delays and data discrepancies.
Scalability Challenges: The existing system wasn’t optimized for large datasets or frequent metric updates, making it difficult for enterprise clients to scale their usage seamlessly.
These issues highlighted the need for a centralized, scalable solution to streamline metric management, reduce manual work, and support our clients’ growth.
Success means delivering a seamless, scalable solution that empowers enterprise clients to manage metrics effortlessly, reduces manual work, and drives higher engagement, satisfaction, and retention—solidifying Cascade Strategy as an essential tool for growth.
02
Research
Given our limited timeline, we conducted a focused research phase to quickly uncover critical insights about our enterprise clients’ needs and challenges. Our approach combined quantitative data analysis with qualitative feedback, allowing us to build a clear picture of the main pain points.
User Interviews: Conducted brief interviews with a sample of enterprise clients to understand their workflows and pinpoint specific frustrations with metric tracking.
Data Analysis: Reviewed app usage data and support tickets to identify patterns, including high manual update frequency and recurring pain points related to scalability.
Competitive Analysis: Analyzed industry-leading tools to benchmark best practices in metric management, highlighting opportunities for streamlined data handling and automation.
Key Findings
Heavy Reliance on Manual Tracking: Clients were spending significant time manually updating metrics, which led to delays, inconsistencies, and reduced overall efficiency.
Challenges with Large Datasets: Enterprise clients found it difficult to manage large and complex datasets, leading to performance issues and making it hard to scale their tracking.
High Demand for Automation: Clients expressed a strong need for automated features to reduce manual workload and improve data accuracy, aligning with industry standards seen in competitor tools.
These insights directly informed our design decisions, enabling us to focus on features that would maximize impact for our enterprise clients within our time constraints.
03
Thinking
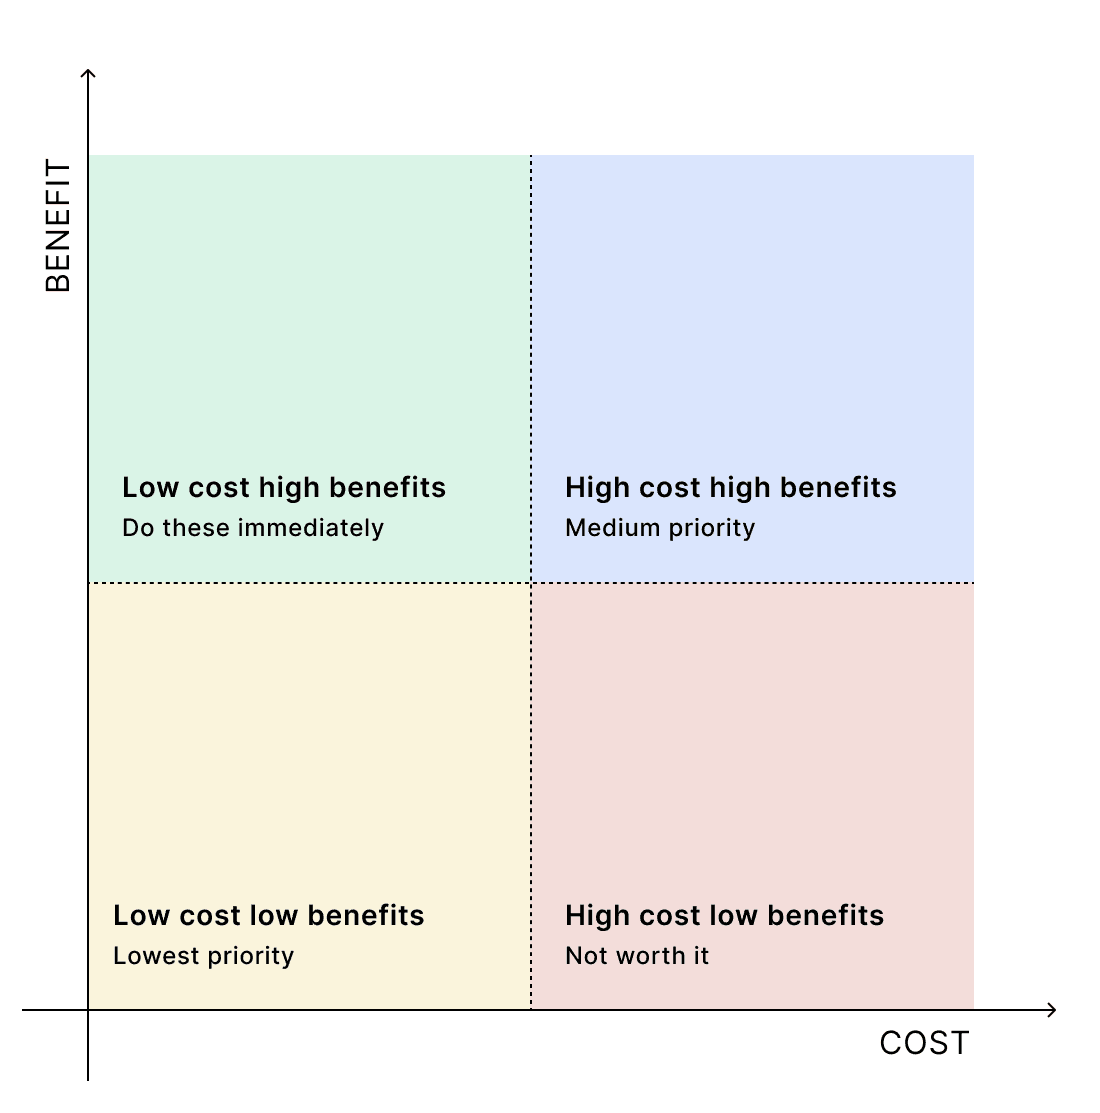
With a limited timeline, our team, including product management and engineering, worked collaboratively to prioritize features based on impact/benefit and feasibility/cost.
We focused on solutions that directly addressed the most pressing client pain points while considering development constraints.
Design Solutions
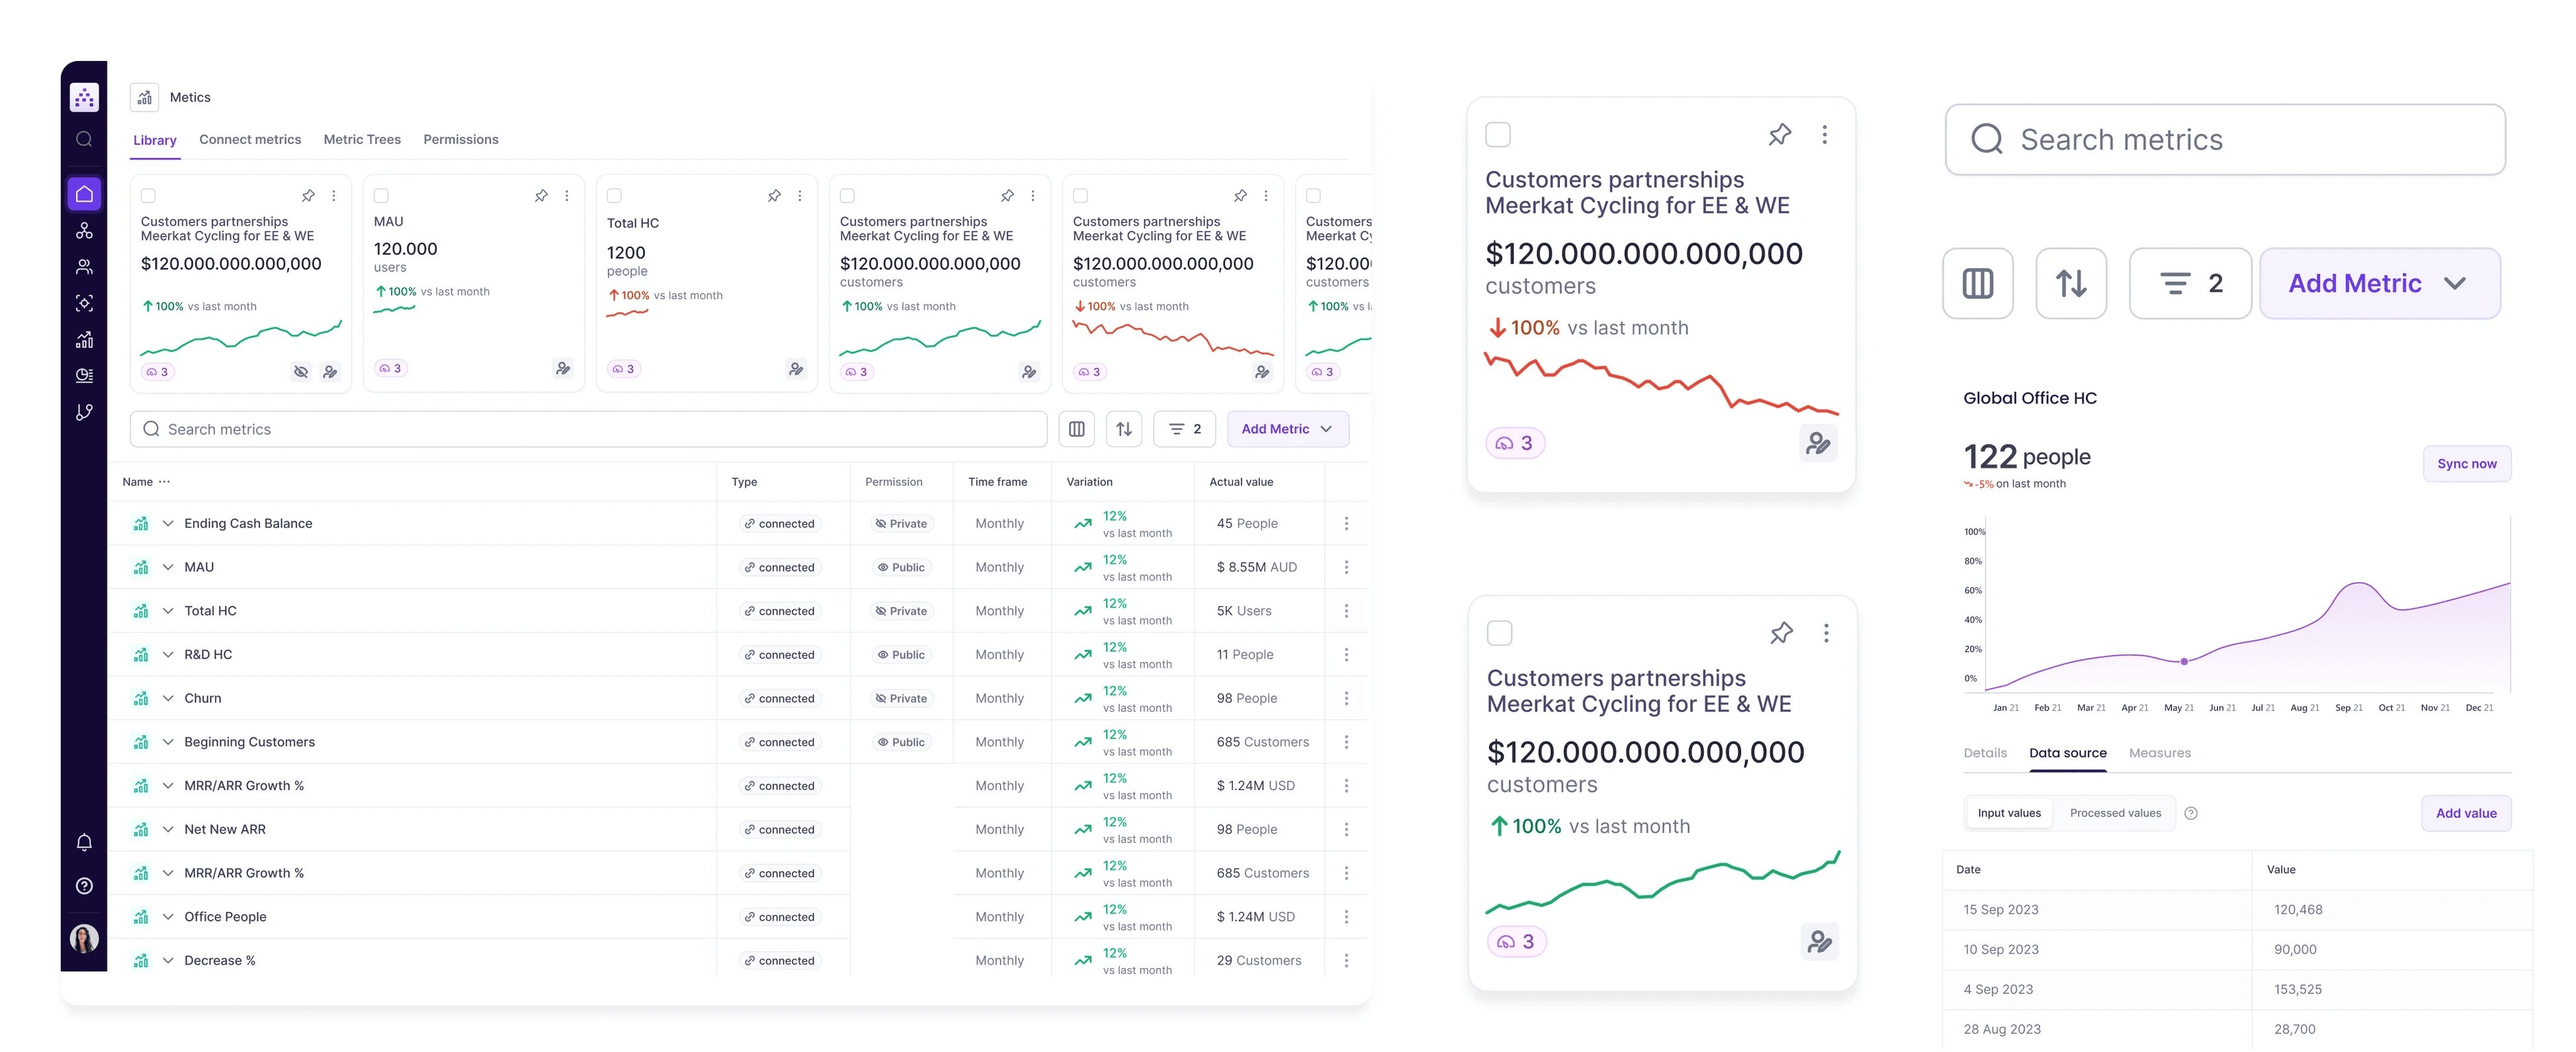
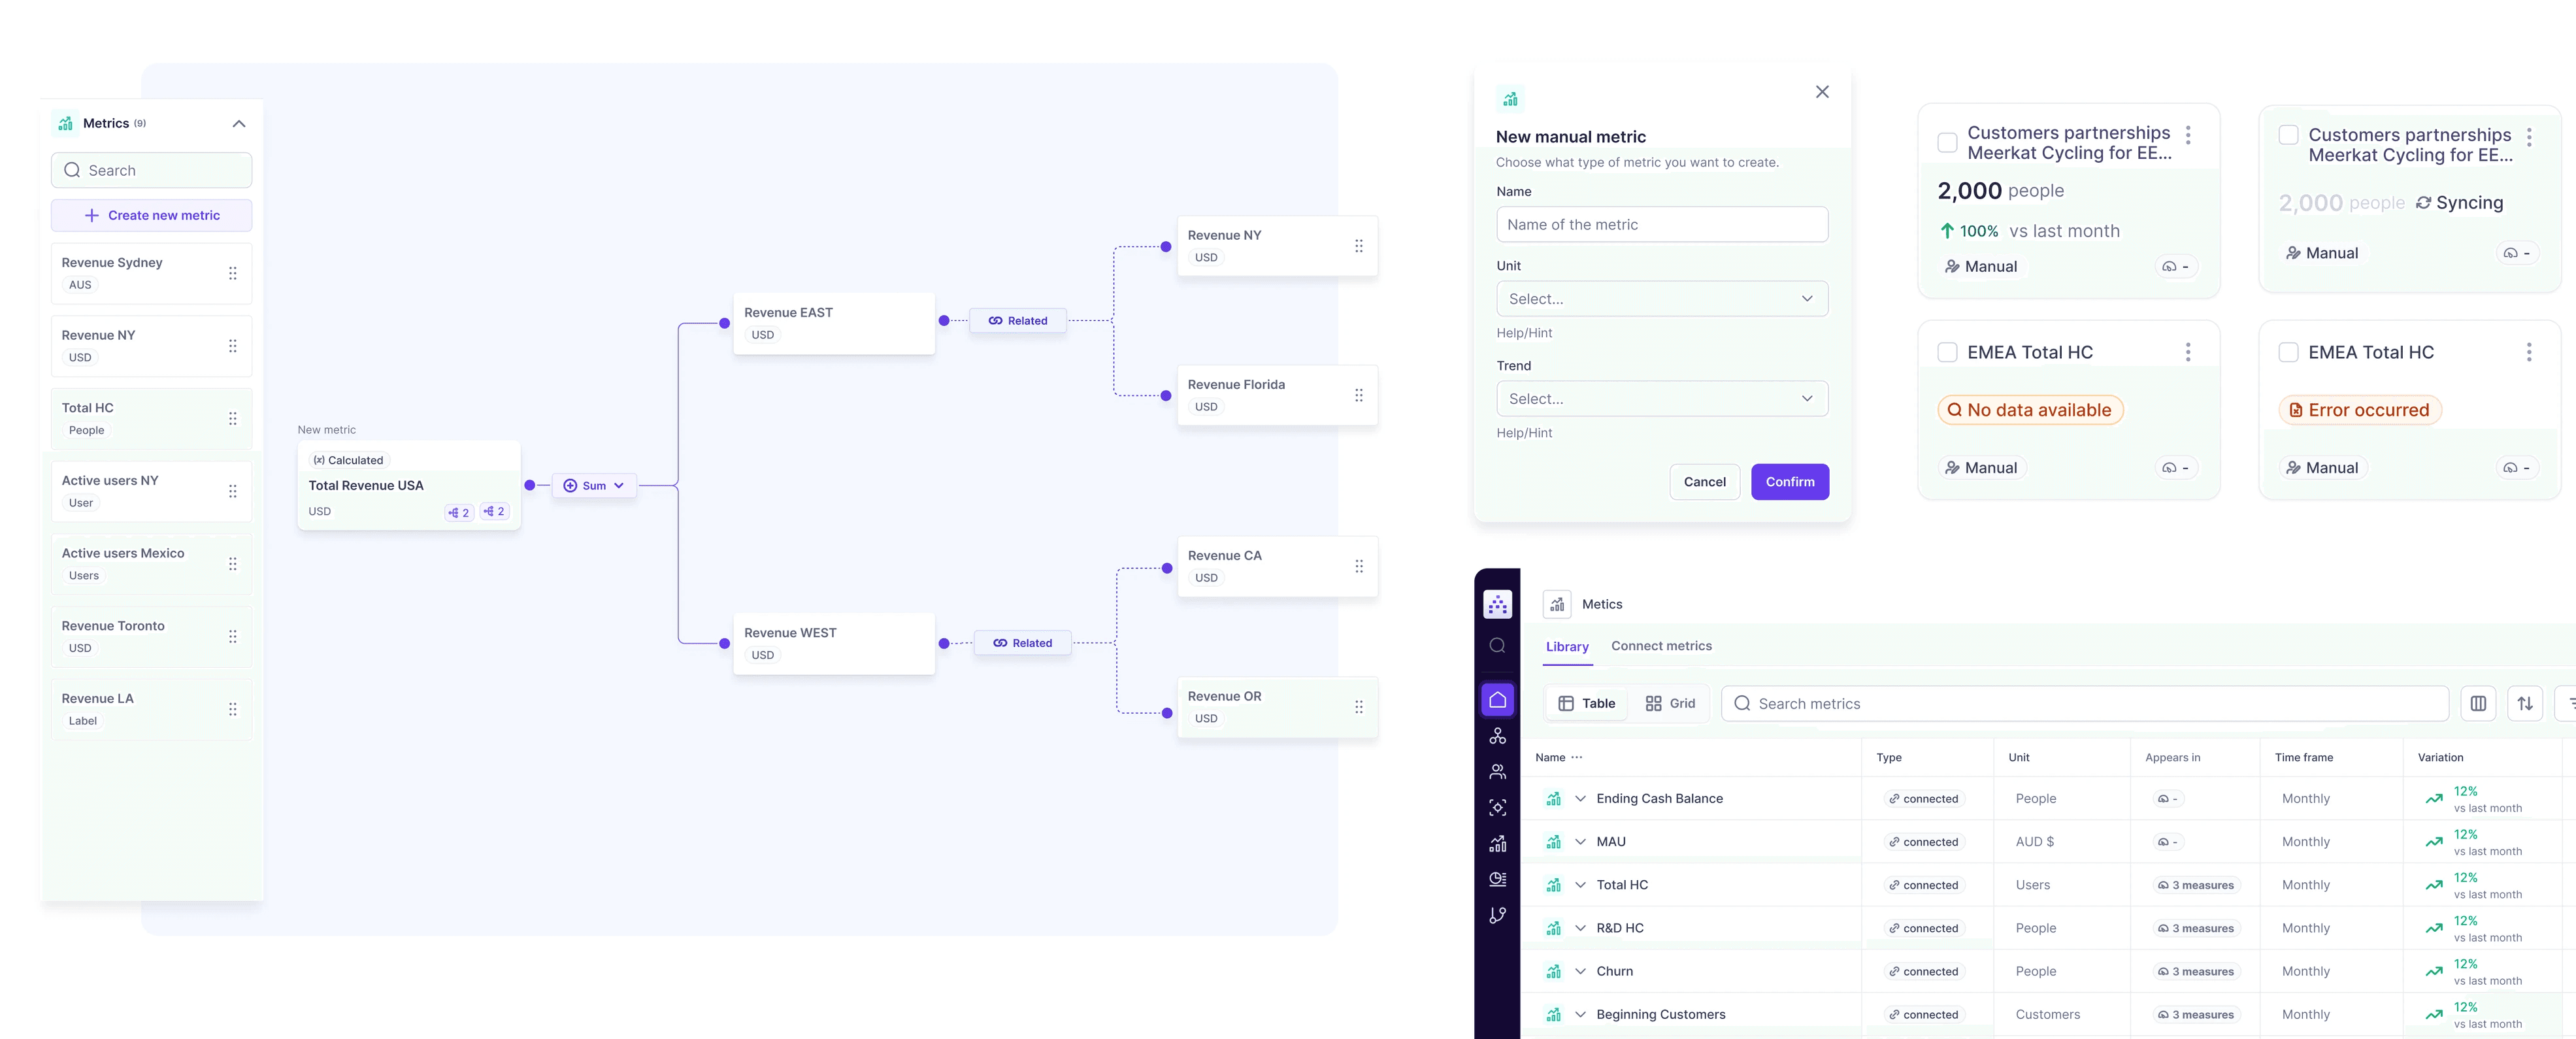
Centralized Metric Dashboard
Automated Data Syncing
Customizable Views and Filters
Streamlined Onboarding Experience
04
Design
To bring Metrics Hub to life, we followed a structured design process, moving from initial sketches to polished, high-fidelity designs. Leveraging our design system allowed us to create a cohesive and scalable interface that seamlessly integrated with the rest of the platform.
Sketches and Initial Concepts
Wireframes and Mid-Fidelity Mockups
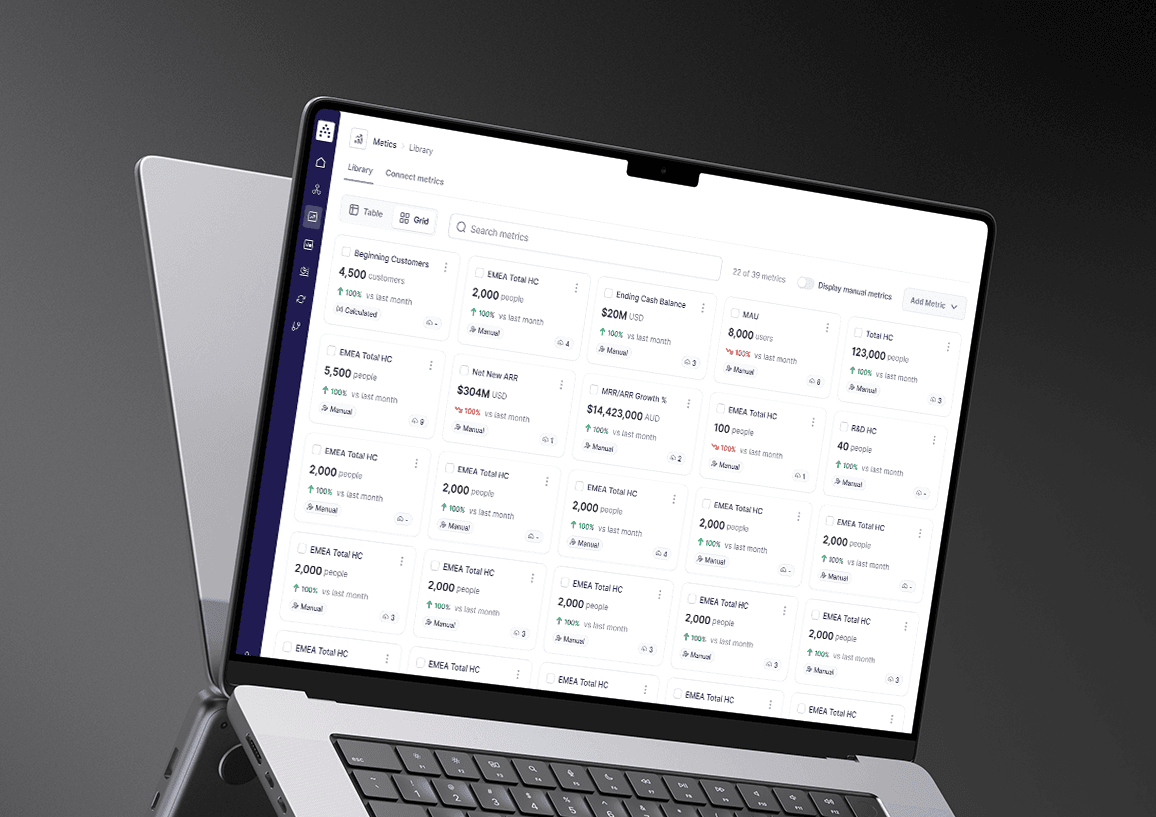
High-Fidelity Designs and Prototypes
Design System Integration
05
Impact
The Metrics Hub rollout led to measurable improvements in client satisfaction, efficiency, and engagement:
3x Increase in Average Contract Value (ACV): The added value of Metrics Hub drove higher contract renewals and upgrades among enterprise clients.
28% Faster Activation: Simplified onboarding and intuitive design reduced the time clients needed to start using Metrics Hub effectively.
Improved Client Satisfaction: Positive feedback highlighted the convenience of centralized tracking and automated updates, with many clients reporting greater efficiency and accuracy.
Higher Retention Rates: Enhanced usability and automation features contributed to improved client retention among enterprise users.